Guide to Essential Biostatistics XX: Chi-square test: goodness of fit for sample validation
In the previous articles in this series, we explored the Scientific Method, Proposing Hypotheses and Type-I and Type-II errors, Designing and implementing experiments (Significance, Power, Effect, Variance, Replication, Experimental Degrees of Freedom and Randomization), Critically evaluating experimental data (Q-test; SD, SE, and 95%CI) as well as Two-Sample Means Comparisons (the t-test) and ANOVA.
The chi-squared distribution or χ2-distribution, developed by English mathematician and statistician Karl Pearson in 1900 is a widely used probability distribution in inferential statistics and is a component of the t-distribution, f-distribution, the Analysis of Variance and regression analysis.
Chi-squared tests for the goodness-of-fit (within-sample deviations)
The chi-squared distribution is also used in chi-squared tests for the goodness of fit of an observed distribution – a component of experimental validation – by comparing expected and observed values.
In a typical validation study example, a within-sample comparison for individual observed values of bacterial counts on Petri dishes against average observed values is required to conform to an acceptance criterion, for example, within-sample deviation of χ2 must conform to p>0.05 (see example below).
If the chi-square test indicates that the test result exceeds the stipulated criteria limit (we speak of the chi-square test failing to support the Null hypothesis: there is no difference between the counts) possible outliers may be removed from the evaluation. No more than 20% of the counts (one in five) may be removed.
If the Chi-square test fails after the removal of possible outliers – i.e. if p<0.05 – the sample is considered invalid and must be rejected.
In the following example, bacterial counts of a microbial biopesticide are performed on five Petri dishes. The Null hypothesis is that there is no difference between the observed counts (O), relative to the average (and thus expected, E) count:

The deviation for each count relative to the average (E) was calculated as:
(O-E)^2/E
…while the χ2 value (the sum of deviations for each count relative to the average (E) is calculated as:
χ2 = Σ(O-E)^2/E
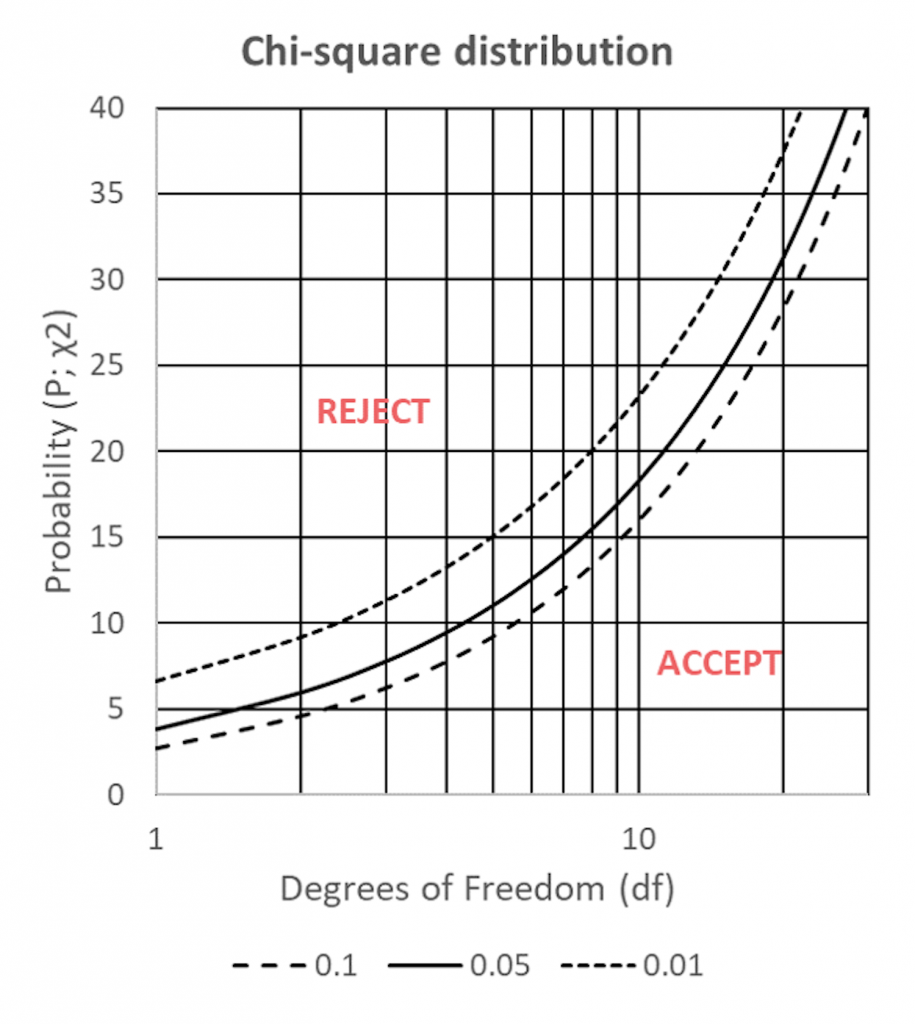
The calculated probability (P; χ2) – the likelihood that the within-sample deviation between expected (E) and observed (O) counts is due to chance – can be compared to the table values in Figure 1 for n-1 degrees of freedom (df).
If the χ2 probability lies above the 5% significance curve (p<0.05; Figure 11.1) the probability that the deviations are due to chance are small – the sample is considered invalid and must be rejected.

Figure 1: χ2 distributions for 2-20df; for 1%, 5% and 10% significance.
Conversely, if the χ2 probability falls below the 5% significance curve (p>0.05) the probability that the deviations are due to chance is great – the sample conforms to the acceptance criteria and can be accepted.
For our example, the calculated within-sample comparison values for individual observed counts against average observed counts (χ2=0.63) are less than the critical value of 9.49 for 4df at 5% significance (Figure 11.1) and the sample thus conforms to the acceptance criteria and can be accepted.
Thanks for reading – please feel free to read and share my other articles in this series!
GUIDE TO ESSENTIAL BIOSTATISTICS is now published and available in eBook and Print formats!
Are you a student, researcher or science leader looking for an overview of the essential principles of Biostatistics?
Guide To Essential Biostatistics is an easily accessible primer for scientists and research workers not trained in mathematical theory, but who have previously followed a course in Biological Statistics.
This book provides a readily accessible overview on how to plan, implement and analyse experiments without access to a dedicated staff of statisticians.
Guide To Essential Biostatistics contains few calculations (the “how” of Biostatistics) but instead provides a plain-English overview of the “why” – what is it the numbers are telling us, and how can we use this to plan trials, understand our data and make decisions.
Designed to fit in a lab coat pocket for easy access, Guide To Essential Biostatistics compiles some of the most-used biostatistical techniques, approximations and rules-of-thumb used in the design and analysis of biological experiments.
Buy this book to obtain an overview of essential aspects of Biostatistics! By purchasing the print edition of this book on AMAZON, you are eligible for a FREE download of the eBook version, providing access to high-resolution, zoomable color images.
A little about myself
I am a Plant Scientist with a background in Molecular Plant Biology and Crop Protection.
20 years ago, I worked at Copenhagen University and the University of Adelaide on plant responses to biotic and abiotic stress in crops.
At that time, biology-based crop protection strategies had not taken off commercially, so I transitioned to conventional (chemical) crop protection R&D at Cheminova, later FMC.
During this period, public opinion, as well as increasing regulatory requirements, gradually closed the door of opportunity for conventional crop protection strategies, while the biological crop protection technology I had contributed to earlier began to reach commercial viability.


