Guide to Essential Biostatistics XXI: A Short History of Applied BioStatistics
In the previous articles in this series, we explored the Scientific Method, Proposing Hypotheses and Type-I and Type-II errors, Designing and implementing experiments (Significance, Power, Effect, Variance, Replication, Experimental Degrees of Freedom and Randomization), Critically evaluating experimental data (Q-test; SD, SE, and 95%CI) as well as Two-Sample Means Comparisons (the t-test) and ANOVA.
The first quarter of the 20th century was an intense period of statistical development driven in part by advances in the science of genetics, and in part by the need to develop mathematical methods for the study of heredity and evolution.
It culminated by providing non-mathematical scientists with computationally simple tools for the design and analysis of their experiments based on elementary algebra, rather than on complex matrix functions and integrals.
Most of the statistical methods used by researchers in the biological sciences today stem from the insight of a handful of statisticians, and their interactions.
Four statistical pioneers in particular are immortalized in the distributions and statistical methodologies named after them.
Their influence is so significant to contemporary research in the biological sciences that the history and origins of their insights, statistical distributions and tests – in such common use today – is worth recounting.
English mathematician and biostatistician Karl Pearson (1857-1936) is credited with the establishment of modern mathematical statistics.
Among many other contributions to statistics, Karl Pearson introduced the p-value, or probability value – the probability of finding the observed results when the null hypothesis is true as well as the term “standard deviation” in 1894 to replace the earlier “root mean square error” and “error of mean square”.
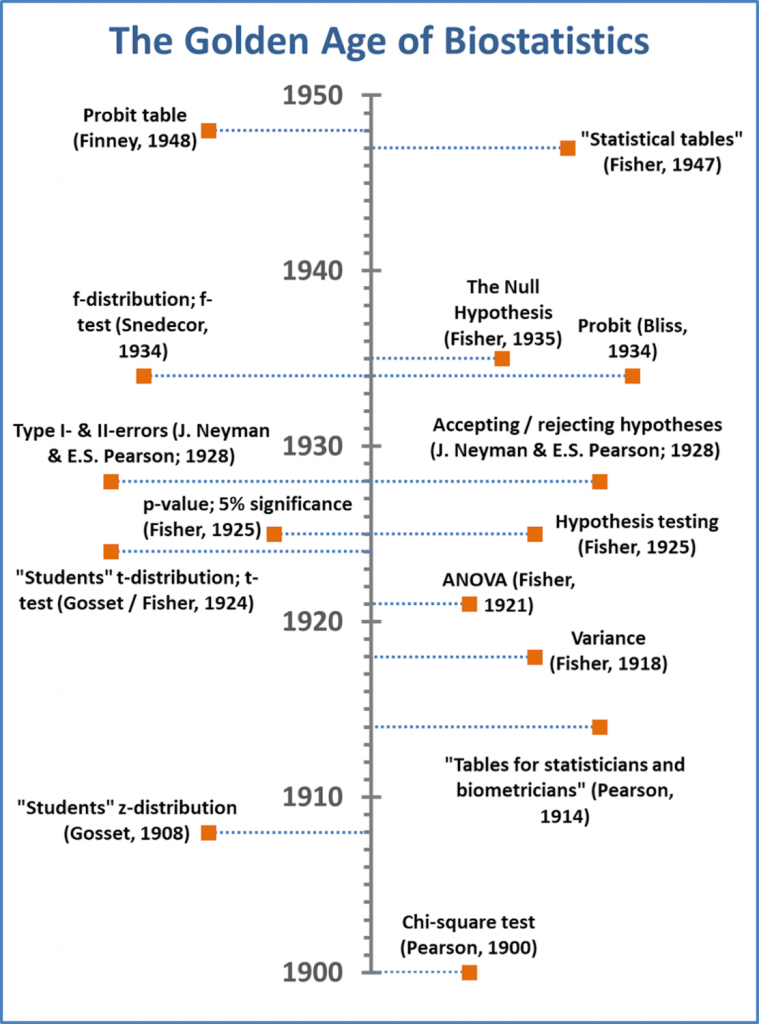
In addition, Karl Pearson created the first volume of statistical tables in “Tables for statisticians and biometricians” (1914).
George Waddel Snedecor (1881-1974) was an American mathematician and statistician, and a pioneer of modern applied (as opposed to mathematical) statistics. Snedecor was dedicated to developing statistical methods for scientists not trained in mathematical theory, facilitating the interpretation of data within the biological sciences.
Snedecors “Statistical methods applied to experiments in agriculture and biology” (1937) and “Statistical methods” (1938) are considered seminal in the development of applied statistics for research workers.
Perhaps the greatest name in the developing field of applied statistics for the biological sciences is that of British statistician and geneticist Ronald A. Fisher (1892-1962).
Fisher contributed to the design and statistical analysis of experiments for non-mathematical research workers through his position as statistician at the Rothamsted Agricultural Experiment Station, the oldest agricultural research Institute in the United Kingdom.
Fisher’s most important contributions to statistical methods include the introduction of the concept of randomization, and the analysis of variance to compare the means of multiple samples, providing solutions to issues of variance arising from factors such as the heterogeneity of soils and the variability of biological material.
Several of his most important contributions were published in “Statistical methods for research workers” (1925).
Fisher focused on the development of methods for small samples (typical for the crop studies carried out at Rothamsted) and identified the distributions of many sample statistics, publishing “The design of experiments” in 1935 and “Statistical tables” in 1947 (following on from Karl Pearson’s previously published book of tables.
William Sealy Gosset (1876-1937) was a chemist and statistician hired by the Guinness Brewery to apply biochemistry and statistics to Guinness’ industrial processes.
Gosset introduced the z-statistic to test the means of small, normally-distributed samples for quality control in brewing, and published it anonymously under the name “Student” in Biometrika (1908), following a sojourn at Karl Pearson’s laboratory in London.
Gosset’s test was adapted by Fisher to incorporate the concept of “degrees of freedom” (introduced by him in its statistical context) in a 1924 paper.

Gosset himself appears to have introduced the t-nomenclature (t-distribution; t-test) in correspondence with Fisher. The t-statistic is thus also termed Students t-distribution and Students t-test.
In contrast to Pearson (who sought correlations in large samples), Fisher and Gosset used small samples more typical for agricultural trials and sought causes rather than correlations.
Their differences in statistical approaches lead to increasingly bitter disputes between Pearson and Fisher, leading Fisher to decline the post of chief statistician under Karl Pearson and fortuitously (especially for experimenters in the biological sciences) chose the position as a statistician at Rothamsted instead.
In contrast, Gosset was able to maintain good relations with both Pearson and Fisher – an admirable feat of diplomacy possibly nurtured by his passion for beer… Gosset would go on to become Chief Brewer at Guinness.
Of relevance for the contents of this book, hypothesis testing in its modern form was extensively applied in R.A. Fishers “Statistical methods for research workers” (1925), while the concept of accepting or rejecting hypotheses and of Type-I and Type-II error; originally referred to as “the first source of error” and “the second source of error”) were presented by J. Neyman and E.S. Pearson (son of Karl Pearson) in 1928.
Fisher introduced the null hypothesis in “The design of experiments” (1935), noting that the normal hypothesis is never proved or established but is possibly disproved in the course of experimentation”.
Although the p-value was introduced by Karl Pearson, it was extensively applied and disseminated in R.A. Fishers “Statistical methods for research workers” (1925).
Here, he advocated the 5% significance level, identifying that 1.96 standard deviations around the mean is the approximate value of the 97.5 percentile point of the normal distribution.
This in turn led to the rule of thumb of two standard deviations for statistical significance in a normal distribution. One cannot help noticing the irony in light of the ongoing (often heated) debate regarding the use of p-values rather than fixed significance levels!
The f-test was initially developed by Fisher as the variance ratio (defined as the ratio of explained variance (or between-group variability) to unexplained variance (or within-group variability) in the 1920s.
The f-distribution was subsequently tabulated, and the f-test named, by Snedecor in 1934 as an improved presentation of Fisher’s Analysis of Variance, in order to facilitate its interpretation within the biological sciences.
Probit (“probability unit”) models were developed by American biologist and statistician Chester Bliss (1899 – 1979) in 1934, as a convenient method to evaluate dose response in pesticide data.
Probit allowed researchers to convert mortality (effect) percentages to probit values, which approximated a straight line function between the logarithm of the dose and effect which can be analyzed by simple linear regression methods.
The Probit model was further adapted and tabulated at Rothamsted by British statisticians D. J. Finney (1917 – 2018) and W. L. Stevens in 1948 to avoid having to work with negative probits in an era before the ready availability of electronic computing.
It is these Probit tables that even today ensure that dose-response fitting to evalute dose-response relationships may be conveniently performed when statistical software packages are not available, and experimenters do not have a background in mathematics.
It is unlikely that we will again experience a period as dynamic as that of the early 20th century for the advancement of statistical methods in the biological sciences.
We should continue to recognize the contributions of the period’s leading statisticians in developing experimental planning and analysis methods capable of driving the advances in Science of the 20th century – methods which are still applicable and in use almost a century later.
Thanks for reading – please feel free to read and share my other articles in this series!
GUIDE TO ESSENTIAL BIOSTATISTICS is now published and available in eBook and Print formats!
Are you a student, researcher or science leader looking for an overview of the essential principles of Biostatistics?
Guide To Essential Biostatistics is an easily accessible primer for scientists and research workers not trained in mathematical theory, but who have previously followed a course in Biological Statistics.
This book provides a readily accessible overview on how to plan, implement and analyse experiments without access to a dedicated staff of statisticians.
Guide To Essential Biostatistics contains few calculations (the “how” of Biostatistics) but instead provides a plain-English overview of the “why” – what is it the numbers are telling us, and how can we use this to plan trials, understand our data and make decisions.
Designed to fit in a lab coat pocket for easy access, Guide To Essential Biostatistics compiles some of the most-used biostatistical techniques, approximations and rules-of-thumb used in the design and analysis of biological experiments.
Buy this book to obtain an overview of essential aspects of Biostatistics! By purchasing the print edition of this book on AMAZON, you are eligible for a FREE download of the eBook version, providing access to high-resolution, zoomable color images.
A little about myself
I am a Plant Scientist with a background in Molecular Plant Biology and Crop Protection.
20 years ago, I worked at Copenhagen University and the University of Adelaide on plant responses to biotic and abiotic stress in crops.
At that time, biology-based crop protection strategies had not taken off commercially, so I transitioned to conventional (chemical) crop protection R&D at Cheminova, later FMC.
During this period, public opinion, as well as increasing regulatory requirements, gradually closed the door of opportunity for conventional crop protection strategies, while the biological crop protection technology I had contributed to earlier began to reach commercial viability.


