Guide to Essential Biostatistics XVII: Inferential Statistics – post ANOVA tests
In the previous articles in this series, we explored the Scientific Method, Proposing Hypotheses and Type-I and Type-II errors, Designing and implementing experiments (Significance, Power, Effect, Variance, Replication, Experimental Degrees of Freedom and Randomization), Critically evaluating experimental data (Q-test; SD, SE, and 95%CI) as well as Two-Sample Means Comparisons (the t-test).
Post-ANOVA tests are typically performed after the f-ratio has indicated that not all means are equal.
Depending on our requirements, different post-ANOVA tests allow different comparisons, for example: to compare every mean to every other mean (the most common application), to compare each mean to a control mean, or to compare selected means.
Among the post-ANOVA tests to compare every mean to every other mean, we are provided with a number of methods, the most common of which (at least in the biological sciences) are the Tukey’s test and the Newman-Keuls test (or Student-Newman-Keuls test; SNK).
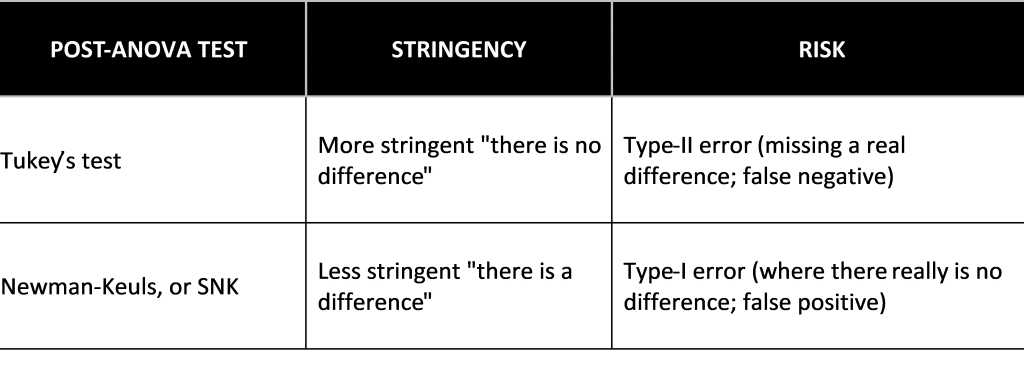
The Newman-Keuls post-ANOVA test is considered less stringent (has less power – see previous article on Power) than Tukey’s test, and may indicate that a difference in means is statistically significant, whereas the more stringent Tukey’s test might indicate that the difference is not statistically significant.
As the risk of a Type-I error (where there really is no difference) is greater for the Newman-Keuls test than for the Tukey test, statisticians tend to recommend Tukey’s test.
However, for Tukey’s test the chance of a Type-II error (missing a real difference) is greater. This is the “one that got away” type error, also termed “false negative”, where you miss out on something that really is extraordinary.

Figure 1: Summary of post-ANOVA tests most commonly used to identify differences between all group means.
Taking the strategic research objectives into consideration will facilitate a reasoned choice of test method. Thus, if the cost of a false positive is high (for example if it leads to the initiation of a costly development process) a more stringent method to determine the significance of differences between treatment means such as Tukey’s test may be appropriate.
Conversely, if the cost of a false negative is high (leading to you missing out on a valuable discovery) a less stringent method such as Newman-Keuls test may be appropriate.
Newman-Keuls test may thus be appropriate for early-stage discovery processes, while Tukey’s may be more appropriate as a decision-making tool as discovery candidates approach development phases.
The means and results of post-ANOVA tests are typically presented as bar graphs (with error bars correctly defined), where different letters above bars (means) indicate significant differences (p<0.05). Conversely, bars labeled with the same letter are not significantly different from each other.
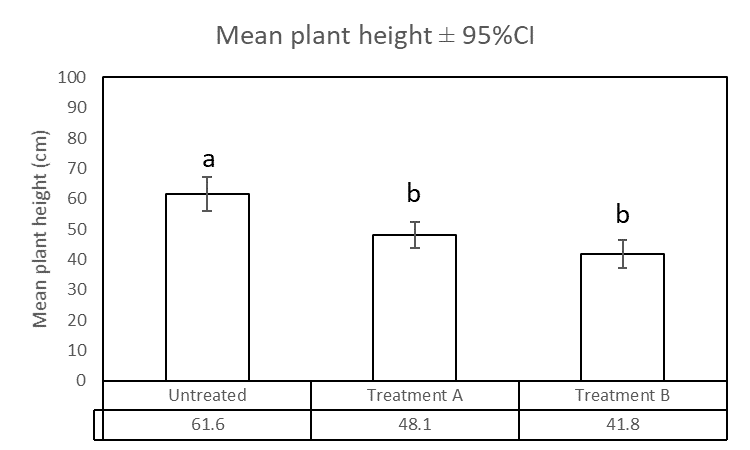
For the example dataset above, performing Tukey’s test indicates that the means of treatment A and Treatment B are significantly different from the untreated control (p<0.001) while the difference between the means of Treatment A and Treatment B is not significantly different (p>0.05).

Figure 2: Mean plant heights for untreated control and two herbicide treatments. Different letters above bars indicate significant differences (p<0.05; Tukey’s post-ANOVA test).
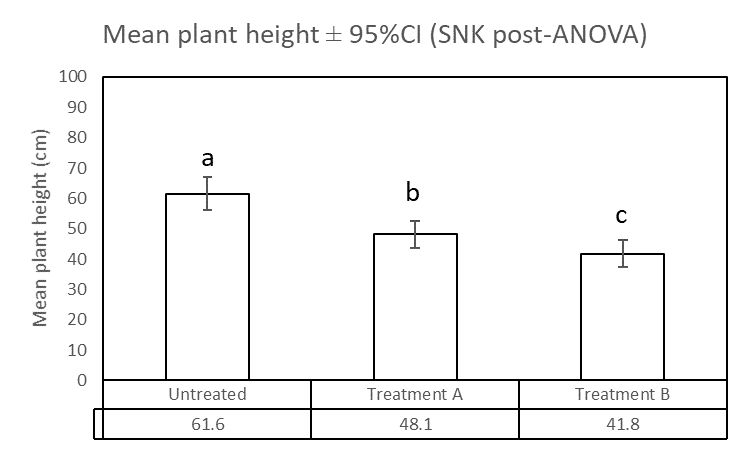
In contrast, applying the SNK test to the example dataset confirms that the means of treatment A and Treatment B are significantly different than that of the untreated control (p<0.001) while the lower stringency of this tests indicates that the difference between the means of Treatment A and Treatment B is significantly different (p<0.05):

Figure 3: Mean plant heights for untreated control and two herbicide treatments. Different letters above bars indicate significant differences (p<0.05; SNK post-ANOVA test).
A number of additional post-ANOVA tests are available for specific comparisons (to compare each mean to a control mean, or to compare selected means, e.g. Bonferroni’s test), or for situations for which the assumption of equal variances may (e.g. Duncan’s test – a more stringent modification of the Newman-Keuls test i.e. with more power) or may not (e.g. Dunnett’s test) be required. These necessitate an in-depth understanding of statistical analysis and are thus outside the scope of this book – the reader is encouraged to refer to a statistician.
_______________________________
Thanks for reading – please feel free to read and share my other articles in this series!
The first two books in the LABCOAT GUIDE TO CROP PROTECTION series are now published and available in eBook and Print formats!
Aimed at students, professionals, and others wishing to understand basic aspects of Pesticide and Biopesticide Mode Of Action & Formulation and Strategic R&D Management, this series is an easily accessible introduction to essential principles of Crop Protection Development and Research Management.
A little about myself
I am a Plant Scientist with a background in Molecular Plant Biology and Crop Protection.
20 years ago, I worked at Copenhagen University and the University of Adelaide on plant responses to biotic and abiotic stress in crops.
At that time, biology-based crop protection strategies had not taken off commercially, so I transitioned to conventional (chemical) crop protection R&D at Cheminova, later FMC.
During this period, public opinion, as well as increasing regulatory requirements, gradually closed the door of opportunity for conventional crop protection strategies, while the biological crop protection technology I had contributed to earlier began to reach commercial viability.


