Guide to Essential BioStatistics XI: Selecting a statistical test – Data Scales (Types)
In the previous articles in this series, we explored the Scientific Method and Proposing Hypotheses and Type-I and Type-II errors, Designing and implementing experiments (Significance, Power, Effect, Variance, Replication, Experimental Degrees of Freedom and Randomization), as well as Critically evaluating experimental data (Q-test; SD, SE, and 95%CI).
In the following articles, we will explore: Concluding whether to accept or reject the hypothesis (F- and T-tests, Chi-square, ANOVA and post-ANOVA testing).
In this eleventh article in the LabCoat Guide to BioStatistics series, we learn about the role of Data Scales (Types) in selecting a statistical test.
Descriptive and Inferential statistics
In the previous articles, Descriptive statistics were shown to provide a summary of our dependant (see earlier articles) variable data in the form of measures of central tendency (mean) and measures of variability (standard deviation, standard error of the mean, etc.).
In contrast to Descriptive statistics on sample data, Inferential statistics move beyond the immediate data to infer the significance of observed differences between treatments, and thus whether our data allows us to reject the null hypothesis.
The key to successful inferential statistics is obtaining a representative sample. As we have seen in the previous articles, two important factors determining how representative a sample is, are replication and sample size.
Hypothesis testing
Hypothesis testing is a means of drawing conclusions about a population mean, and a range of tests are available to determine whether a hypothesis about the mean is true or not.
The choice of test is determined by the scale (type) and distribution of the data. The following section provides a brief overview of data scales or types.
Types of Data
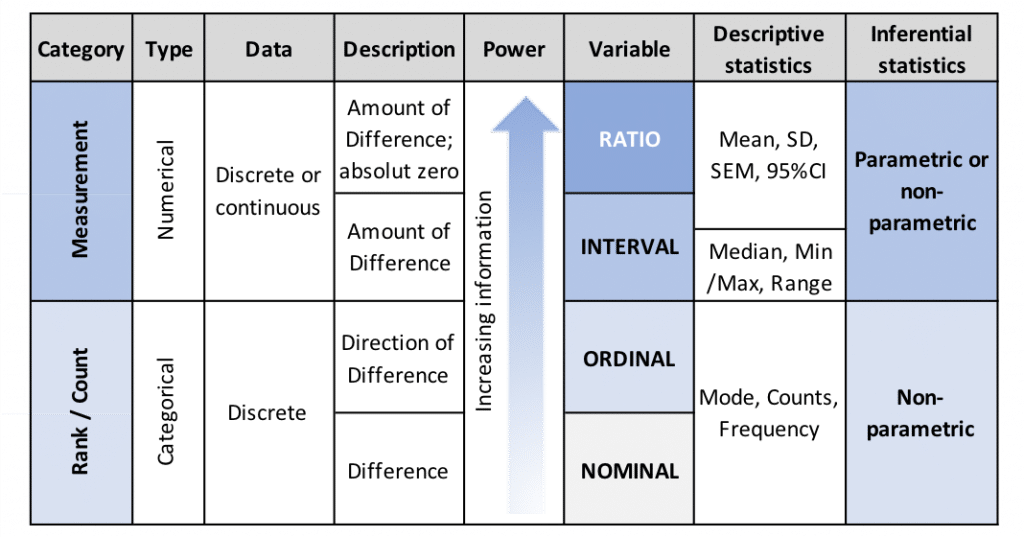
Most experimental biological data are in the form of measurement data, or data expressed using an interval or ratio scale. The following provides a brief hierarchical overview of the four principal data scales, or types.
Figure 11.1: Hierarchy of dependent variable data scales (types) and descriptions, including a summary of appropriate descriptive and inferential statistical analysis methods.
Nominal and Ordinal data
Nominal (non-numeric) and Ordinal (categorical numeric) data are rarely encountered in biological testing and comprise categorical or discrete variables and are typically described by two or more values (categories).
Due to their non-numeric nature, it is possible to differentiate, but not to order or rank Nominal (such as “male” / “female”) data.
In contrast, it is possible to rank Ordinal data (such as shortest to tallest plant), providing an additional aspect of direction to the simple binary differentiation of Nominal data. However, ordinal data categories do not have an equivalent distance between them, so a relative magnitude of the difference cannot be determined.
Nominal and Ordinal data may be summarized using descriptive statistics (mode, count, frequency) and hypotheses may be tested using nonparametric inferential statistics which do not assume a Normal or Gaussian distribution (see next article).
As Nominal and Ordinal data do not indicate the magnitude of the difference, they are referred to as rank or count data.
Interval and Ratio data
In contrast to Nominal and Ordinal data, Interval and Ratio data allow us to determine the magnitude of the difference and are thus referred to as measurement data. Interval and Ratio data comprise continuous (as opposed to discrete) numeric variables and may contain any value with a finite or infinite interval, such as plant height, insect mass, disease incidence or -severity.
Data on an Interval scale do not contain a true zero (for example, temperature measured in degrees Centigrade or Fahrenheit), while data on the Ratio scale (such as weight or height) provide a true or absolute zero, from which we, for example, may determine that a treated plant is double as tall as an untreated control plant.
Interval and ratio data may be summarized using descriptive statistics (median, minimum/maximum, range) for interval data, or (mean, standard deviation, standard error of the mean and 95% confidence interval) for both interval and ratio data. Hypotheses may be tested using parametric inferential statistics (which assume a Normal or Gaussian distribution) – the topic of the next article.
Thanks for reading – please feel free to read and share my other articles in this series!
The first two books in the LABCOAT GUIDE TO CROP PROTECTION series are now published and available in eBook and Print formats!
Aimed at students, professionals, and others wishing to understand basic aspects of Pesticide and Biopesticide Mode Of Action & Formulation and Strategic R&D Management, this series is an easily accessible introduction to essential principles of Crop Protection Development and Research Management.
A little about myself
I am a Plant Scientist with a background in Molecular Plant Biology and Crop Protection.
20 years ago, I worked at Copenhagen University and the University of Adelaide on plant responses to biotic and abiotic stress in crops.
At that time, biology-based crop protection strategies had not taken off commercially, so I transitioned to conventional (chemical) crop protection R&D at Cheminova, later FMC.
During this period, public opinion, as well as increasing regulatory requirements, gradually closed the door of opportunity for conventional crop protection strategies, while the biological crop protection technology I had contributed to earlier began to reach commercial viability.
I am available to provide independent Strategic R&D Management as well as Scientific Development and Regulatory support to AgChem & BioScience organizations developing science-based products.
For more information, visit BIOSCIENCE SOLUTIONS – Strategic R&D Management Consultancy.


