Guide to Essential BioStatistics VII: Designing and implementing experiments – Experimental Degrees of Freedom
In this seventh article in the LabCoat Guide to BioStatistics series, we learn about Experimental Degrees of Freedom.
In the previous articles in this series, we explored the Scientific Method and Proposing Hypotheses and Type-I and Type-II errors.
Future articles will cover: Designing and implementing experiments (Significance, Power, Effect, Variance, Replication and Randomization), Critically evaluating experimental data (Q-test; SD, SE and 95%CI), and Concluding whether to accept or reject the hypothesis (F- and T-tests, Chi-square, ANOVA and post-ANOVA testing).
Experimental Degrees of Freedom
An alternate method to determine the number of replicates required for an experiment is based on the experimental degrees of freedom.
Degrees of freedom refer to the number of independent pieces of information used to calculate the statistic. The degrees of freedom are calculated by subtracting one from the number of samples in your data set.
The minimum accepted number of degrees of freedom required for a trial design to be considered adequate is 12 (EPPO Guidelines, Design and analysis of efficacy evaluation trials – EPPO PP 1/152(4)).
However, this should be increased if there is low precision in the measurements taken, and for biological trials, a minimum residual degrees of freedom of 15 is considered appropriate for a useful statistical analysis.
▶︎ A biological rule of thumb is that the minimum accepted number of degrees of freedom required for a trial design is ≥12
Simply put – for a one-sample statistical test, i.e. two treatments (one herbicide sample plus an untreated control), one degree of freedom is spent estimating the mean of the sample, while the remaining n-1 degrees of freedom are available to estimate variability.
One-sample degrees of freedom
For an efficacy data set for one herbicide with ten replicates, the degrees of freedom will be:
10df (1 sample x 10 replicates) – 1 sample df = 9df
Here the degrees of freedom may be increased by increasing the replication. If this is not possible, degrees of freedom may be increased by increasing the number of treatments or the number of sites (replication of the experiment).
Two-sample degrees of freedom
For a two-sample t-test, i.e., three treatments (two herbicide samples plus an untreated control) one degree of freedom is spent estimating each mean, while the remaining n-2 degrees of freedom are available to estimate variability.
If you are comparing the efficacy of two herbicides at comparable doses (i.e., 3 treatments: two herbicides plus the untreated control), with 10 replicates for each treatment, the degrees of freedom will be:
20df (2 samples x 10 replicates) – 2 sample df = 18df
Degrees of Freedom for a single, completely randomized site
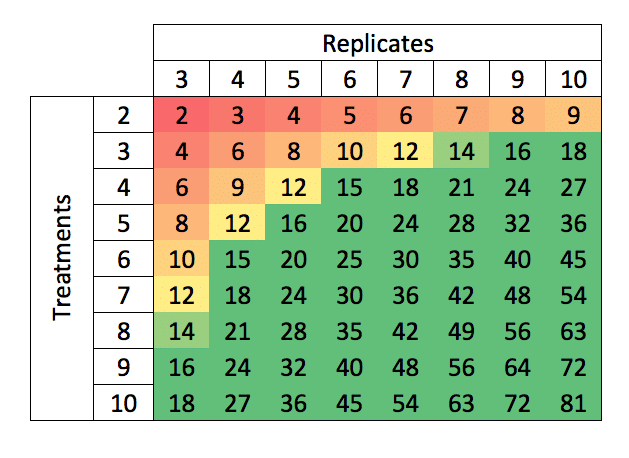
Degrees of Freedom for a single, completely randomized site (e.g., a typical greenhouse trial) for selected combinations of Replicates and Treatments may conveniently be obtained from the following table:

Figure 1: Degrees of freedom corresponding to combinations of replicates and treatment numbers.
From this table we can see that for a trial with 4 treatments (3 herbicide samples plus an untreated control) and 3 replicates, there are only 6 residual df. We will thus need at least 5 replicates to obtain df=12, while 6 replicates to obtain df=15 would be preferred.
Alternatively, we could repeat this trial at an additional site – doubling the df to 12, or (as is common for crop protection field trials) at three sites, tripling the degrees of freedom to 18.
Now that we have determined how large our trial needs to be (sample size; replicates), this would be an excellent time to head out into the greenhouse and consider how our trial is to be set up! In the next article, we will consider randomization and design.
Once we have identified the number of replicates to be used in our experiment, we may now consider how to assign or distribute our experimental units. This will be covered in the next article.
Thanks for reading – please feel free to read and share my other articles in this series!
For more information, visit BIOSCIENCE SOLUTIONS – Strategic R&D Management Consultancy.
The first two books in the LABCOAT GUIDE TO CROP PROTECTION series are now published and available in eBook and Print formats!
Aimed at students, professionals, and others wishing to understand basic aspects of Pesticide and Biopesticide Mode Of Action & Formulation and Strategic R&D Management, this series is an easily accessible introduction to essential principles of Crop Protection Development and Research Management.
A little about myself
I am a Plant Scientist with a background in Molecular Plant Biology and Crop Protection.
20 years ago, I worked at Copenhagen University and the University of Adelaide on plant responses to biotic and abiotic stress in crops.
At that time, biology-based crop protection strategies had not taken off commercially, so I transitioned to conventional (chemical) crop protection R&D at Cheminova, later FMC.
During this period, public opinion, as well as increasing regulatory requirements, gradually closed the door of opportunity for conventional crop protection strategies, while the biological crop protection technology I had contributed to earlier began to reach commercial viability.


