Guide to Essential BioStatistics I: The Scientific Method
In this first article in the LabCoat Guide to BioStatistics series, you will learn essential principles of the Scientific Method. Future articles will cover: Proposing a hypothesis, Designing and implementing experiments (Significance, Power, Effect, Variance, Replication and Randomization), Critically evaluating experimental data (Q-test; SD, SE and 95%CI) and Concluding whether to accept or reject the hypothesis (F- and T-tests, Chi-square, ANOVA and post-ANOVA testing).
Introduction
Many published papers in biology contain serious statistical mistakes, and many corporate decisions are made on the basis of erroneous statistical analyses. We repeatedly observe the perception among biologists and corporate decision-makers alike, that statistical methods somehow transform raw data into accurate scientific conclusions. However, statistical methods are often applied with little understanding of the basis for their choice, and even when performed correctly statistical tests are often misunderstood and misinterpreted.
This series is intended as a basic refresher for scientists and technicians who have previously followed a course in Biological Statistics, and who need a readily accessible overview on how to avoid the most basic pitfalls when planning and implementing experiments, as well as analysing and understanding experimental data without easy access to a dedicated staff of statisticians.
Disclaimer: I am not a statistician. The information presented here comprises approximations and rules of thumb which I have found useful in designing and analyzing non-critical trials only. For critical trials always seek the advice of a qualified statistician.
The Scientific Method
The Scientific Method is the mainstay of R&D and provides an objective and systematic approach to experimentation, by minimizing the influence of experimenter bias or prejudice in the form of preconceived notions.
By adhering to the rigorous methodology of the scientific method, experimenters identify and account for errors arising from experimenter bias and fallacies. Confirmation bias is an example of a common source of error in which the tendency is to focus on data supporting a hypothesis while suppressing or ignoring data that does not.
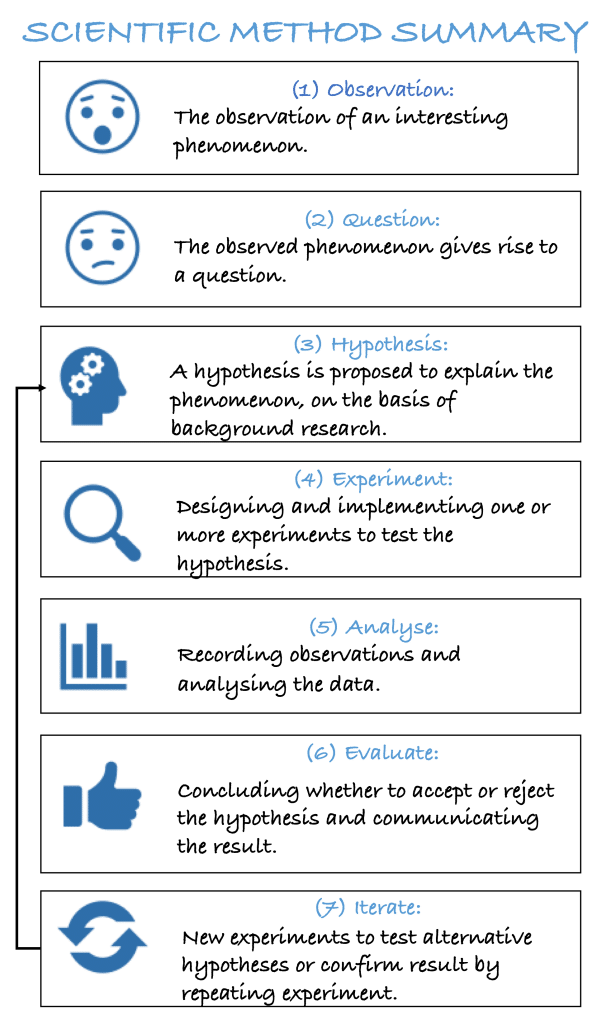
In its simplest form the Scientific Method can be broken down into seven phases:
1. OBSERVE. The observation of an interesting phenomenon.
2. QUESTION. The observed phenomenon gives rise to a question
3. HYPOTHESISE. An explanatory hypothesis is proposed to explain the phenomenon, conducting background research if necessary.
4. EXPERIMENT. Designing and implementing one or more experiments to test the hypothesis. Experiments should be designed to minimize possible errors and bias using appropriate scientific controls and randomization.
5. ANALYZE. Recording observations and analyzing the data. Statistical Trial Planning and Data Analysis are key components of the Scientific Method.
6. EVALUATE. Interpret the data, deciding whether to accept or reject the hypothesis. Publish the results and draw conclusions that serve as a starting point for new hypotheses.
7. ITERATE. Running new experiments to test alternative hypotheses if the original hypothesis is not accepted, or iterative experiments to confirm an/or expand our knowledge if the original hypothesis is accepted.
Table 1: Overview of the Scientific Method
Scientific method example: smartphone charging.
To obtain a more intuitive understanding, let us apply the Scientific Method to an everyday situation – a smartphone that is not charging.
1. Observe
Your smartphone has been on the charger all night, but this morning your smartphone was not charged.
2. Question
Why has my smartphone not charged?
3. Hypothesise
We can hypothesize that IF the smartphone didn’t charge THEN the charger is defective. This hypothesis may then be reworded as a research or working hypothesis:
4. Experiment
To experimentally test the hypothesis, you might predict that using a different charger will solve the issue. Accordingly, you could borrow a charger and see if your smartphone charges – you plug in the replacement charger and attach your smartphone. As we will see later, an experiment has an independent as well as a dependent variable. The independent variable (the charger) can be changed or controlled, and the effect it has on the dependent variable (the smartphone) can be recorded and analyzed.
It’s important to change only one variable for an experiment – for example: if we designed an experiment comprising both a replacement charger as well as a replacement smartphone, we would not be able to deduce anything from the data – we would not know if the issue arose from the original charger or smartphone. From this example, we can intuitively understand the importance of a correctly formulated hypothesis.
5. Analyze
You observe and note whether your smartphone begins to charge on the replacement charger. Ideally, you would repeat this several times to be quite sure of your observations. In our example, we might repeat the charging process ten times and discover that the replacement charger only charged in eight of these instances. Don’t throw out the observations you think may be bad – these provide valuable information which might suggest that it is not the charger that is defective but instead may be the socket which is providing intermittent power.
6. Evaluate
If your smartphone charges consistently, then the hypothesis may be considered to be supported. Alternatively, if your smartphone does not charge consistently, then the hypothesis may be rejected.
In practice, however, we can never be sure that the charger functions consistently (for example the socket may only have a 1% misfunction rate, which we would not observe with few replicates). Thus, although the evidence supports the hypothesis, it does not necessarily mean that the hypothesis is correct. We will consider the implications of this in more detail in the next section.
7. Iterate
If your smartphone charges on the replacement charger, supporting the hypothesis that the original charger is defective, you might propose a new, testable hypothesis: IF the charger is defective THEN the charging tip may need replacing.
Alternatively, if your smartphone does not charge on the replacement charger, you might propose an alternative hypothesis: IF the charger is not effective THEN the power socket may be defective.
This is a very simple example only intended to illustrate the steps of the scientific method and provide an intuitive understanding. In R&D the process is far more complicated and requires us to dig a little deeper into the underlying theory.
With this information on the Scientific Method, we are ready to move on to the next article in this series: Proposing a Hypothesis.
Thanks for reading – please feel free to read and share my other articles in this series!
GUIDE TO ESSENTIAL BIOSTATISTICS is now published and available in eBook and Print formats!
Are you a student, researcher or science leader looking for an overview of the essential principles of Biostatistics?
Guide To Essential Biostatistics is an easily accessible primer for scientists and research workers not trained in mathematical theory, but who have previously followed a course in Biological Statistics.
This book provides a readily accessible overview on how to plan, implement and analyse experiments without access to a dedicated staff of statisticians.
Guide To Essential Biostatistics contains few calculations (the “how” of Biostatistics) but instead provides a plain-English overview of the “why” – what is it the numbers are telling us, and how can we use this to plan trials, understand our data and make decisions.
Designed to fit in a lab coat pocket for easy access, Guide To Essential Biostatistics compiles some of the most-used biostatistical techniques, approximations and rules-of-thumb used in the design and analysis of biological experiments.
Buy this book to obtain an overview of essential aspects of Biostatistics! By purchasing the print edition of this book on AMAZON, you are eligible for a FREE download of the eBook version, providing access to high-resolution, zoomable color images.
A little about myself
I am a Plant Scientist with a background in Molecular Plant Biology and Crop Protection.
20 years ago, I worked at Copenhagen University and the University of Adelaide on plant responses to biotic and abiotic stress in crops.
At that time, biology-based crop protection strategies had not taken off commercially, so I transitioned to conventional (chemical) crop protection R&D at Cheminova, later FMC.
During this period, public opinion, as well as increasing regulatory requirements, gradually closed the door of opportunity for conventional crop protection strategies, while the biological crop protection technology I had contributed to earlier began to reach commercial viability.
I am available to provide independent Strategic R&D Management as well as Scientific Development and Regulatory support to AgChem & BioScience organizations developing science-based products.
For more information, visit BIOSCIENCE SOLUTIONS – Strategic R&D Management Consultancy.


